Published by Salary by Metro · Updated October 14, 2026
Registered nurse pay by metro
The national median is the middle of a large licensed occupation. A metro page is that same row for one area, and it still leaves the weekend differential out.
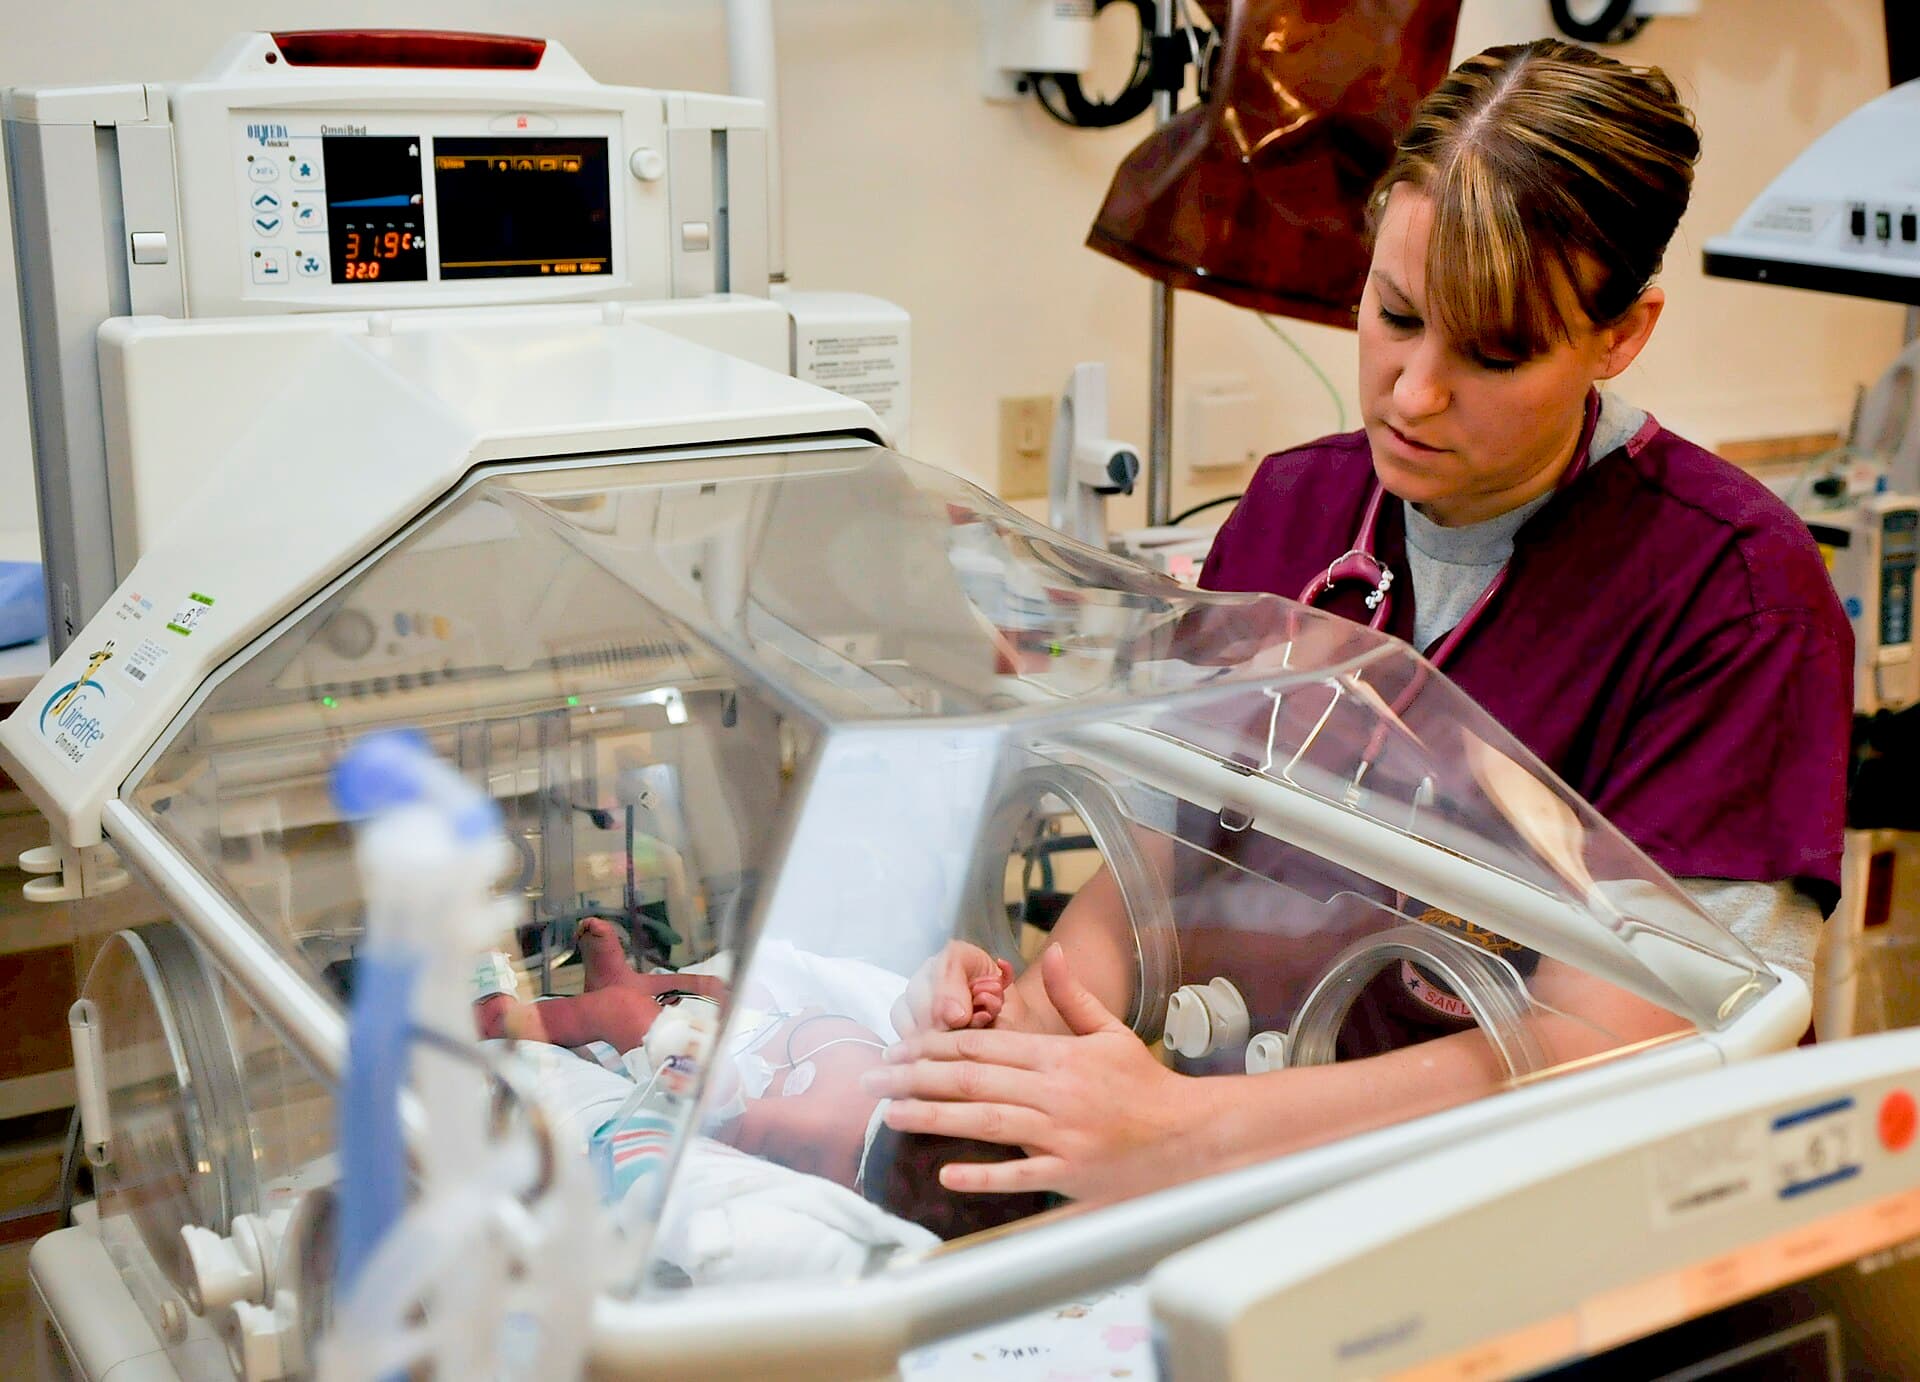

Registered nurses are SOC 29-1141 in the May 2025 Occupational Employment and Wage Statistics estimates. The national page on this site is the hub: one national row, then metros ranked by the published median and by employment. A metro page is the same occupation inside one metropolitan statistical area. The headline is the median. The band around it runs from the 10th percentile to the 90th. None of those cells is a shift differential, a sign-on bonus, or a promise about the next contract.
The national row
Nationally, in the May 2025 estimates released May 15, 2026, employment is 3,379,720. The annual 10th percentile is $68,940, the 25th is $80,330, the median is $97,550, the 75th is $112,350, and the 90th is $137,470. The mean is $101,420. The hourly median is $46.90. Half of the measured wages fall between the 25th and the 75th percentile, $80,330 to $112,350. The mean sits above the median, by $3,870, which is a modest gap for a wage distribution. The all-occupations national median in the same release is $50,980. Nursing pay is centered well above that, and the table is still a distribution, not a single rate.
BLS describes these wages in the May 2025 technical notes at https://www.bls.gov/oes/2025/may/oes_tec.htm. They are straight-time gross pay for wage-and-salary workers. The survey does not include the self-employed. A nurse in an independent practice is outside the estimate. A nurse on a hospital payroll is inside it, in the occupation and the area where the establishment is.
How to read a metro page
Start with Houston-Pasadena-The Woodlands, TX. In May 2025 the median annual wage for registered nurses there is $99,830. The 10th percentile is $74,860, the 25th is $81,890, the 75th is $116,000, and the 90th is $130,440. The mean is $100,290. The hourly median is $48.00. Employment is 65,910. The middle half of local wages, the 25th to the 75th, runs from $81,890 to $116,000. The Texas state median for the same occupation is $95,970, so the Houston median sits a little above the state and close to the national median of $97,550. BLS published each of those cells.
New York-Newark-Jersey City, NY-NJ is a different scale. Employment is 197,740. The median is $119,720, the 10th percentile is $87,180, and the 90th is $159,240. The hourly median is $57.56. The wage covers the whole multi-state area, including the New Jersey counties in the official title. The comparison with a state uses the primary state on the BLS area record, which is New York. The New York state median for registered nurses is $109,440. That is not the New Jersey median, and the page is not using it as one.
San Francisco-Oakland-Fremont, CA publishes a median of $186,610, with a 10th percentile of $119,290, a 90th of $223,770, and a mean of $176,900. Employment is 41,750. The mean sits below the median here, which is the reverse of the national pattern. The California state median is $140,270, well under the San Francisco metro figure, so the state is the wrong citation for a job in that metro. Austin-Round Rock-San Marcos, TX publishes a median of $97,890 and employment of 18,920, close to the national median and close to Houston. The national hub lists more metros than these four. If a cell says the wage is not available, BLS withheld it. The page does not fill the blank.
Weekend differentials are not in the wage
The technical notes are explicit about the boundary. Included: base rate, cost-of-living allowances, guaranteed pay, hazardous-duty pay, incentive pay including commissions and production bonuses, and tips. Excluded: overtime pay, severance pay, shift differentials, nonproduction bonuses, employer cost for supplementary benefits, and tuition reimbursements. A weekend differential, a night differential, and time-and-a-half overtime are premium pay. They are not in the median, the mean, or the percentiles. The table describes straight-time pay. It does not describe the extra pay for nights and weekends, and it cannot separate a nurse whose check is mostly base pay from one whose check depends on the differential.
A cost-of-living allowance that is part of straight-time pay is on the included list. That is not the same thing as a Social Security COLA, and it is not a separate column. If an employer has already folded an allowance into the base rate, OEWS counts it inside the wage and does not label it. The guide on cost-of-living adjustments and merit raises is the place to separate that allowance from a performance raise. The percentile is still only a place in the local distribution.
Take-home, then prices
The take-home card on a job page starts from the published annual median, uses single filing status, and applies the metro's primary state. It estimates 2026 federal income tax, employee Social Security, employee Medicare, Additional Medicare Tax when the wage is high enough, and state income tax. Texas does not tax wages, so a Houston median of $99,830 is estimated with no Texas wage tax. California does tax wages, so the San Francisco median of $186,610 is estimated on California's schedule, with the limits described in the take-home guide. The calculator will take any of those wages, or the national median of $97,550, if you change the state or the filing status. It does not add a shift differential you have not typed in, and it does not invent an annual wage when BLS published only an hourly one. Registered nurses are published on both bases in these metros.
A price comparison is a different question from take-home. Take-home is tax on the nominal wage. Purchasing power divides that nominal wage by a regional price parity. The 2024 all-items parity is 115.613 in San Francisco-Oakland-Fremont and 98.629 in Houston-Pasadena-The Woodlands. The nurse median of $186,610 divided by 115.613 and multiplied by 100 is $161,409 in national prices. The Houston median of $99,830 divided by 98.629 and multiplied by 100 is $101,218. The Bay Area wage is still much higher after prices. A Houston wage with the purchasing power of the San Francisco median is about $159,196, which is $186,610 times 98.629 divided by 115.613, rounded to the nearest dollar. The local Houston median is $99,830. The comparison tool runs that arithmetic for this occupation when you choose the two metros. The wages are May 2025. The parities are 2024. Both years are named because they are not the same release.
Registered nurses, national wages · Registered nurses in Houston · Registered nurses in New York · Registered nurses in San Francisco · Registered nurses in Austin · Take-home on the national RN median · Compare RN pay, San Francisco and Houston · Cost-of-living adjustments and merit raises · How to read a wage percentile · Comparing pay across metros · How take-home pay is estimated